Introduction
A few weeks ago, someone asked on the Julia Discourse forum for assistance how to make their code a bit faster.
The original code posted was (with a few minor modifications)
function myImg(pts::Integer)
    # rotation of ellipse
    aEll = 35.0/180.0*pi
    axes = [1/6,1/25]
    values = collect(linspace(-0.5,0.5,pts))

    # meshes
    gridX = [i for i in values, j in values]
    gridY = [j for i in values, j in values]

    # generate ellipse
    # rotate by alpha
    Xr = cos(aEll).*gridX - sin(aEll).*gridY
    Yr = cos(aEll).*gridY + sin(aEll).*gridX
    img = ((1/axes[1]*Xr.^2 + 1/axes[2]*Yr.^2).<=1).*( 10*pi*Yr);
    return mod(img-pi,2*pi)+pi
end
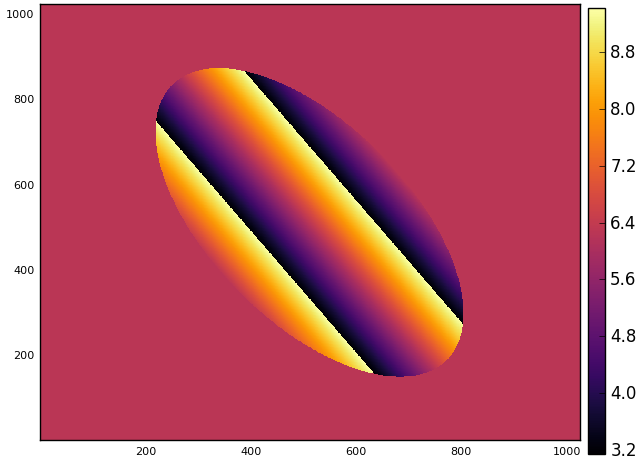
I did not spend too much time trying to figure out the purpose of the code but it looks like it is creating some sort of rotated ellipse. Plotting a heatmap of the resulting matrix confirms this:
julia> using Plots

julia> img = myImg(1024)

julia> heatmap(img)

Analysis
To get an estimate of the time and memory allocation it takes to run the function we can use the @time macro.1
As to not measure compilation overhead, the function is timed twice (here using Julia v0.5).
julia> @time myImg(1024);
  0.117500 seconds (845 allocations: 144.179 MB, 50.45% gc time)
The first thing to do when trying to improve performance of Julia code is to check if there are any type instabilities (see here and here for references) in performance sensitive parts of the code.
Julia provides a macro called @code_warntype which gives colored output where type instabilities are shown in red.
Running @code_warntype myImg(1024) shows, however, that this function is perfectly fine from a type stability point of view.
The @time output, shows a significant amount of time (~50%) is spent in the garbage collector (GC).
This indicates that large amounts of memory is being allocated and released and thus needs to be garbage collected.
The initial goal should thus first be to reduce the amount of memory allocations.2
The most significant memory allocations start with the “mesh grid” type of variables gridX and gridY which are created as
gridX = [i for i in values, j in values]
gridY = [j for i in values, j in values]
Often, creating a mesh grid like this is quite wasteful in terms of memory because we are here storing pts amount of data in 2*pts^2 amount of memory.
Later, these matrices are used to do operations in an “vectorized” fashion:
Xr = cos(aEll).*gridX - sin(aEll).*gridY
Yr = cos(aEll).*gridY + sin(aEll).*gridX
img = ((1/axes[1]*Xr.^2 + 1/axes[2]*Yr.^2).<=1).*( 10*pi*Yr);
return mod(img-pi,2*pi)+pi
This is where the problem with memory allocations sits. For example the command cos(aEll).*gridX has to allocate a brand new matrix to store the result in.
And then again allocate a new matrix for the sin part. And then a new matrix for the subtraction between the two matrices etc.
It is evident that there are a lot of new matrices being created here.3
Code like this is quite common from users coming from a MATLAB programming background, since for loops have traditionally been quite slow there.
In addition to the overhead of allocating memory, this also has the effect that the computer is working with “cold” memory (memory not in cache) a lot.
For good performance, it is important to try to do as much operations as possible on the data while it is in cache before loading new data.
The remedy to the memory and cache problem is to attack the problem along a different dimension. Instead of building up the full result array by doing small operations array by array, it is built up element by element.
My proposed rewrite of the function is:
function myImg2(pts::Integer)
  # rotation of ellipse
  aEll = 35.0/180.0*pi
  axes_inv = [6.0, 25.0]
  values = collect(linspace(-0.5,0.5,pts))

  img = zeros(Float64, pts, pts)
  cosa = cos(aEll)
  sina = sin(aEll)
  @inbounds @fastmath for j in eachindex(values), i in eachindex(values)
      Xr = cosa*values[i] - sina*values[j]
      Yr = cosa*values[j] + sina*values[i]
      v = (axes_inv[1]*Xr^2 + axes_inv[2]*Yr^2)
      k = v <= 1 ? 10*pi*Yr : 0.0
      img[i,j] = mod(k-pi,2*pi)+pi
    end
  return img
end
The “meshgrid” variables gridX and gridY are gone and instead, a nested loop completely computes the result for each element and stores it in img[i,j].
Timing the new function results in
julia> @time myImg2(1024);
  0.011171 seconds (9 allocations: 8.008 MB)
which is a speed up of about 10x and a reduction of memory use by almost 20x without (I would say) making the code much more complicated to read and understand.
Conclusions
Rewriting code that is written in a “vectorized” form can sometimes be beneficial if you see that the code is allocating a lot of memory and the time spent garbage collecting is significant.
Edits:
Removed a section that suggested taking away collect from the values variable. Since we are indexing directly into values it turns out that using an iterator is slightly slower (10%) than using a Vector. Thanks to Simon Danisch
- Instead of using the
@timemacro it is often better to use a dedicated benchmark framework like BenchmarkTools.jl. However, the run time of the function is here quite large so the@timemacro is ok to use. ^ - Typically, it is always good to get in the habit of profiling code before trying to optimize it. “Measuring gives you a leg up on experts who don’t need to measure” – Walter Bright. Julia has a macro
@profilethat together with the package ProfileView.jl gives a flame graph overview of where time is spent. However, when there are glaring performance bottle necks, I typically fix those first before profiling. ^ - Julia 0.6 comes with a cool feature where chained calls to dotted operators (like
.+) are fused. As an example, in 0.6, the commandcos(aEll).*gridX .- sin(aEll).*gridYwould only allocate one array instead of three, as in 0.5. ^